Residential and Nursing Care Market Position Statement 2025 - 2040 - Estimated future demand
Adult Social care demand projections
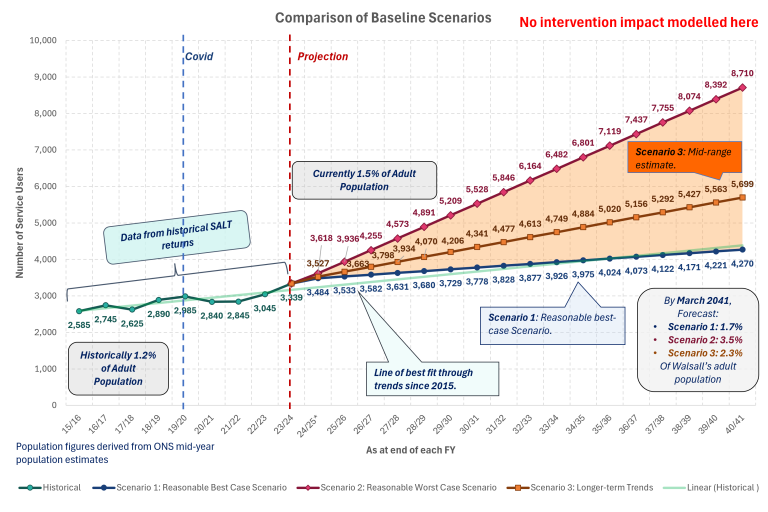
This graph shows different projections in demand for all Walsall Council funded adult social care to 2040. It shows three lines (blue circles, orange squares and dark red diamonds) which project different scenarios.

The light green circles line shows historical trends in numbers of people in receipt of ASC services tracked to date and the dark blue circles line continues this trajectory. This dark blue circles shows that by March 2040 there could be 4,221 service users from a baseline position now of circa 3,500 (17% increase)
The dark red diamond line is based on the increase in the ASC service users in the past 18 months (May 2023 – November 2024). This line is much steeper and number of projected service users is higher because it shows estimated number of service users through to 2040 on a fixed rate if this growth continues. This dark red diamond line shows that by 2040 there could be 8,074 service users from a baseline position now of circa 3.500 (57% increase)
This scenario is a doubling of the size of ASC clients from now to 2040, with an increase of circa 300 clients a year.
The orange square line is a mid-point estimate. It estimates that the number of ASC clients by 2040/2041 could be 5,699 (39% increase).
The orange line is the projection line that Adult Social Care is using to seek to predict and to track overall demand to 2040.
Estimating demand for bed-based care Estimating future demand for different types of bed-based care over the next 15 years is predictive based on a variety of factors. Factors include:
- Projected population growth in Walsall to 2040 (ONS estimated, Poppi and Pansi data)
- Adult Social Care demand projections as above
- Taking into account the impact and lag that covid had on demand
- Public health data such as dementia needs and estimated prevalence and other co-morbidities data, as well as health and equalities data
- Different scenarios that could play out between now and 2040.
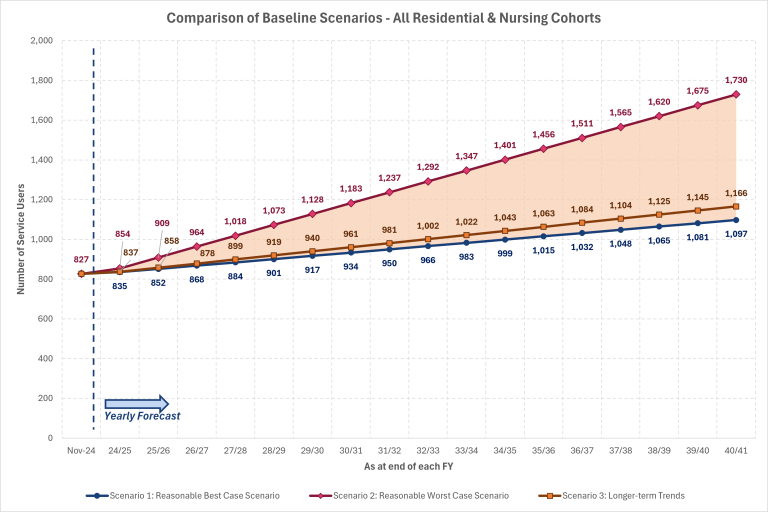
The graph below shows estimated demand projections for residential and nursing care to 2040. It shows three different scenarios:
- The blue line is the lowest demand projection
- The orange line is a mid-point demand projection
- The dark red line estimates the highest demand projection.
Adult Social Care is projecting the orange circle line of 1166 residential and nursing service users by 2040 as the most likely scenario. The table below provides more information on projected demand for different types of residential and nursing care and by age on the mid-point scenario from a baseline position of November 2024. There is a 3-4 year ahead estimation as well as an estimation to March 2040.
| Type of care | Baseline Nov 1st 2024 | End March 2028 | End March 2040 |
|---|---|---|---|
| 65+ specialist (MH, LD) | 119 | 146 | 226 (90% increase) |
| 65+ non-specialist | 583 | 616 | 715 (23% increase) |
| 18-64 specialist (MH, LD) | 96 | 99 | 106 (10% increase) |
| 18-64 non-specialist | 39 | 59 | 120 (208% increase) |
This scenario is based on:
- Using Adult Social Care demand data for the last 12-18 months
- Assume this rate of growth continues and is fixed at this rate (not exponential growth)
- It represents a ‘mid-point scenario’ (orange circle line) for the growth in demand for bed-based care
- It is based on a non-interventionist ‘do nothing’ scenario (i.e. not growing use of community service alternatives to keep people at home and in their communities).

These projections are for Council clients only. Demand projections will be greater as self-funder clients will also grow. A proportion of self-funding clients between now and 2040 will also experience depleted funds and come into the care of the Council. Hence, overall demand projections are expected to be higher than stated here.
Implications Of This Scenario
The implication of this scenario is growth in demand for residential and nursing care from the current baseline. The predicted growth in this scenario is greatest in the 18-64 years of age non-specialist category and 65+ specialist care category.
Currently it is estimated that 17% of the Council commissioned bed-base in Walsall is unoccupied. However, ‘available’ capacity/ supply needs to be considered as there will be issues of choice, Council affordability of beds, quality and other factors that need to be taken into account in assessing capacity and working through new net growth needed to accommodate the demand estimates above.