Market Position Statement 2025 - 2040 Community-Based Services - Estimated Future Demand For Community Based Services
Adult Social Care Demand Projections
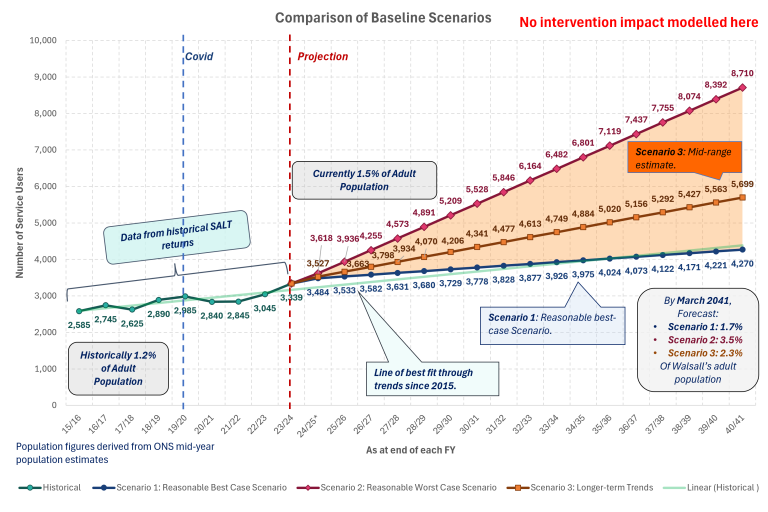
The graph below shows possible scenarios in terms of estimated increase of adult social care service users each year through to 2040/2041.
The light blue circle line shows historical trends in numbers of people in receipt of ASC services tracked to date and the dark blue circle line continues this trajectory. This dark blue circle line shows that by March 2040 there could be 4,221 service users from a baseline position now of circa 3,500 (17% increase).
The dark red triangle line is based on the increase in the ASC service users in the past 18 months (May 2023 – November 2024). This line is much steeper and the number of projected service users is higher because it shows estimated number of service users through to 2040 on a fixed rate if this growth continues. This dark red triangle line shows that by 2040 there could be 8,074 service users from a baseline position now of circa 3.500 (57% increase).
This scenario is a doubling of the size of ASC clients from now to 2040, with an increase of circa 300 clients a year.
The orange square line is a mid-point estimate. It estimates that the number of ASC clients by 2040/2041 could be 5,699 (39% increase). The orange square line is the projection line that Adult Social Care is using to seek to predict overall demand to 2040/2041.

Projected demand for Walsall Council Adult Social Care to 2040/2041
Estimating future demand for community -based services over the next 15-16 years is predictive based on a variety of factors. Factors include:
- Projected population growth in Walsall to 2040 (ONS estimated, Poppi and Pansi data)
- Adult Social Care demand data - historical, last 18 months, last 12 months -see above overall ASC demand scenarios
- Taking into account the impact and lag that covid had on demand
- Public health data such as dementia needs and estimated prevalence and other co-morbities data
- Different scenarios that could play out between now and 2040.
Homecare Demand Projections
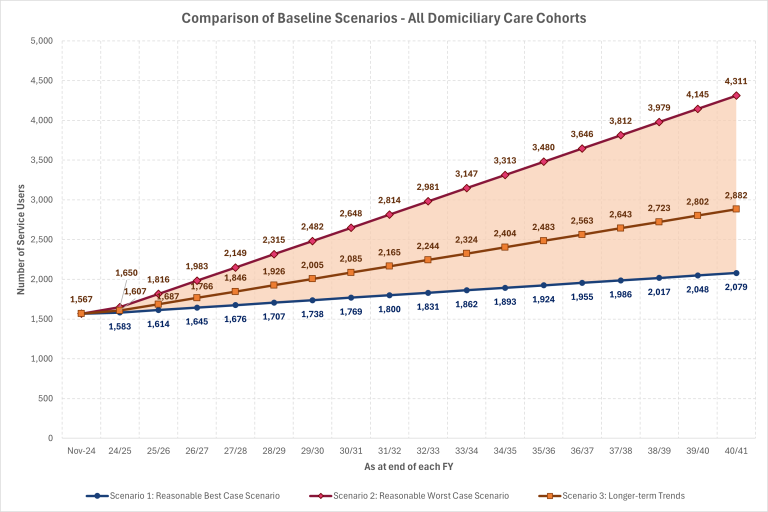
The graph below shows predicted demand for homecare to 2040/2041.

Predicted demand for Council commissioned homecare to 2040/2041.
The table below takes data in this graphs and sets out predicted demand for homecare based on the mid-point scenario from a baseline position of November 2024.
There is a 3-4 year ahead estimation as well as an estimation to March 2040.
This scenario is based on:
- Using ASC demand data for the last 12-18 months
- Assume this rate of growth continues and is fixed at this rate (not exponential growth)
- It represents a ‘mid-point scenario’ (orange line) for the growth in demand for bed-based care
- It is based on a non-interventionist ‘do nothing’ scenario (i.e. not doing more to manage demand for/ placements in bed-based care and grow more preventative and early intervention services).
| Type of homecare | Baseline Nov 1st 2024 | End March 2028 | End March 2040 |
|---|---|---|---|
| 65+ specialist (MH, LD) | 45 | 48 | 54 (20%) |
| 65+ non-specialist | 1236 | 1520 | 2372 (91.9%) |
| 18-64 specialist (MH, LD) | 147 | 173 | 251 (70.8%) |
| 18-64 non specialist | 179 | 185 | 203 (13.4%) |
Implications Of This Scenario
The implication of this scenario is growth in demand for homecare from the current baseline. The predicted growth in this scenario is greatest in the following categories of 65+ non-specialist homecare and 18-64 years of age specialist homecare.
Implications For Supply Of Homecare
This scenario suggests that there will be 319 more Council funded homecare clients receiving Council commissioned homecare in just over 3 years and 1273 extra people by March 2040. Given that there is more homecare supply than demand currently, this suggests that in the next 3 years the capacity already within Walsall should be enough to contain this growth. However, there will need to be additional homecare capacity grown incrementally over the next 15 years to cater for the predicted increase in demand. This capacity needs to be able to cater for both non-complex and complex homecare for all age groups 18+.
It could be that the volume of growth needed is restricted to less providers to ensure economies of scale and sustainability of these homecare agencies. Given that a large proportion of growth is expected to be in over 65s non-specialist (frailty, isolation, drop-ins, food preparation and access to the community), it is also suggested that alternative forms of support are considered through VCSE organisations and other agencies alongside CQC registered homecare providers. For those CCQ registered homecare providers in the market or who wish to join the new Framework in 2027, specialisms in younger adult’s complex care is welcomed.
Locality based homecare models with lead locality providers working with a network of agencies and providers is likely to be a preferred model for the future in Walsall.
Given current supply in Walsall and these demand projections, the following types of care are considered a priority for market development:
- Over 65s non-complex homecare
- Under 65s complex homecare (Learning disability and mental health)
- CQC rated ‘Good’ or better providers
- Homecare located in wards that have least homecare packages currently:
- Streetly
- Paddock
- Rushall Shelfield
- Bentley and Darlaston North
- Willenhall North
Demand projections for other community -based services need to be developed. This includes reablement, Extra Care Housing, Day provision, Prevention and Early Help Services, Carers Support.