- 44 out of 167 Walsall neighbourhoods (LSOAs) are amongst the most deprived 10% in England compared to 34 in 2015
- The 2019 Index of Multiple Deprivation ranks Walsall as the 17th most deprived English local authority (out of 317), placing Walsall within the most deprived 10% of districts in the country (33rd in 2015, 30th in 2010 and 45th in 2007)
- There are extremes of deprivation, with central and western areas typically much more deprived than eastern areas, although pockets of deprivation exist even in the more affluent parts of the Borough
- Walsall fares particularly badly in terms of income (16th), education, skills & training deprivation (11th) and employment (38th) and many of the issues that challenge the Borough match the geography of deprivation
- The high and increasing levels of child poverty puts additional demands on services. Walsall ranks 17th for income deprivation affecting children index (IDACI 2019) with the Borough’s relative deprivation increasing over time (27th in 2015)
- 1 in 3 (29.9%) aged under 16 years are living in low -income families, higher than the national average of 20.1% (HMRC, 2016)
- By the end of January 2017, 20.8% of primary school pupils were entitled to free school meals compared to the national average of 14.5% and 30.2% of secondary school pupils
Market Position Statement 2025-2040 Introduction - Walsall Demographics
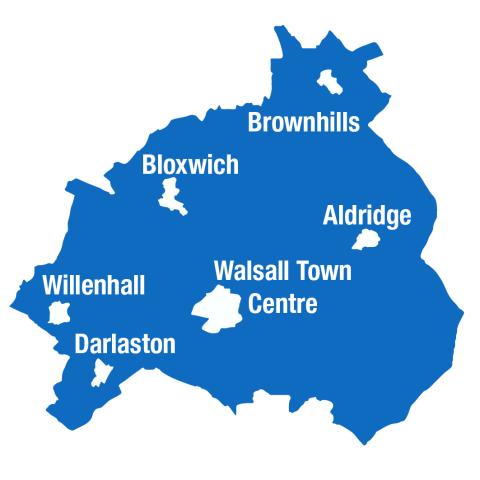
Walsall Borough is made up of six towns:
- Aldridge
- Bloxwich
- Brownhills
- Darlaston
- Walsall
- Willenhall
Image
The Borough had an estimated 286,700 residents in 2021 (2021 Census).
The population comprised approximately 21.7% children 0-15 (62,300), 60.8% working-aged 16-64 (174,300), 17.5% 65 years & over (50,100). Hence the adult population 18+ was estimated to be 224,100 people in 2021.
It is currently estimated in 2024 that the Walsall population is 294,800.
Each of our 20 wards has its own distinct identity and diverse characteristics. This brings a vibrant character to the borough, but also means we need to understand the range of needs faced by those living within all our communities.
Walsall Council Locality profiles.
Walsall is expected to see continued & consistent population growth, projected to increase by 7% to an estimated 304,400 by 2030 & further by 13% to an estimated 320,400 by 2040 (2020 ONS, 2018-based projections). The largest increases are expected within older age groups; the population over 65 years of age will increase their share of the population from approximately 18% to 20% by 2040.
Walsall is one of the most socially deprived areas of the West Midlands, ranking 3rd for both the Indices of Multiple Deprivation (IMD) and the Income Deprivation Affecting Older People (IDAOP) measures. In terms of healthrelated indicators, Walsall takes the 4th position, reflecting its ongoing commitment to addressing social and health disparities within the community.
Walsall stands as the 7th largest Local Authority within the West Midlands region when considering the size of its adult population. Additionally, it holds the 10th largest proportion of adults aged 65 and over among all Local Authorities in the West Midlands.
This insight website gives more detail on Borough-wide and ward level demographics. Walsall Borough comprises 20 wards, many of which vary greatly from one another. By understanding their characteristics, we can better determine what the needs of its residents may be, and the services that they may require. This is best shown through the ward profiles, which have been created using a wide variety of data to give a snapshot of each ward’s demographic, residential and economic composition.
Summary of Walsall’s demographics
Disadvantage and deprivation
Walsall is one of the most socially deprived areas of the West Midlands ranking 3rd in the Indices for Multiple Deprivation and the Income Deprivation Affecting for Older People measure. Walsall is the 17th poorest Local Authority area nationally and 14th poorest Local Authority affecting children; high number of worklessness households and lower than average GCSE or higher attainment. The intra-Borough inequality is therefore very stark in Walsall. In the West of the Borough in places such as Darlaston the % of low income households is over 40% whereas in Streetly in the East of the Borough, this figure is 6%.
Health Profile of Walsall Citizens
Across the West Midlands Combined Authority (WMCA), both life expectancy and healthy life expectancy remain lower the national average. This has been exacerbated by the coronavirus pandemic, with our Black, Asian and Minority Ethnic communities among those most affected in line with national findings.
Life expectancy at birth for men in Walsall is 77.8 and 79.8 nationally which is 2 years less than the national average. The latest figure for life expectancy for women in Walsall is 82 which is lower than the England figure of 83.4 years by 1.4 years.
Overall health in Walsall is poorer than the average for England, with 77.3% of residents saying their health is good or very good, compared to 81.2% nationally. Current “healthy life expectancy” – the number of years lived in good health – is 57.7 for men and 57.2 for women, below the England average of 63.3 and 63.9 years respectively, and lower than Wolverhampton, Dudley and (for women) Sandwell. One in five Walsall residents has a limiting health condition. There will be different rates for different minority ethnic groups.
Other Public Health indicators Public health profiles - OHID (phe.org.uk)
- 75.3% of the Walsall adult population is obese -higher than England and West Midlands averages
- According to an obesity rate table for UK, Walsall has the 4th highest obesity rate in the UK
- Walsall’s adult population is consistently more inactive that England ‘s sample population
- Opiate and crack cocaine use is high in Walsall compared to West Midland and England average rates
- Recorded prevalence of diabetes is higher in Walsall compared to West Midlands and England average rates
- Premature mortality rates due to cancer, cardiovascular disease primarily heart disease are high in Walsall compared to England and West Midland averages other than for colorectal cancer which sees comparable rates to other areas
- Most conditions are worse and more prevalent in the West of the Borough linked to disadvantage and deprivation in that area
- Emergency hospital admissions due to falls have risen in Walsall in the past 10 years but is lower than West Midlands and England average fall rates.
Ethnicity of Walsall Citizens
Walsall is culturally diverse where people of Indian, Pakistani and Bangladeshi background form the largest minority ethnic group. 19% of the Walsall population is Asian. Walsall also has a small Eastern European community of around 1% of residents (2,700) . White British comprise the largest ethnic group at approximately 67.4% of the Borough population, and more broadly the wider White ethnic category at 71.4%. Minority ethnic groups have seen substantial increases, now accounting for 32.6% (1 in 3) of Walsall’s population, compared to 23.1% (1 in 4) a decade prior in 2011.
Ethnic composition varies substantially when viewed by Walsall’s individual wards. In Palfrey, for instance, at 61%, the Asian population is the largest ethnic group, with Pakistani the largest Asian ethnicity: 4,262 people residing there (25.6%, or 1 in 4 people). White British (22.8%), Indian (16.3%) and Bangladeshi (16.1%) are the other major ethnicities residing in Palfrey. Much of Southern Walsall is similarly mixed.
Conversely, Pelsall has the largest White British population, comprising 92.6% of the population (10,586 people).
This weblink gives more information on the demographic and ethnicity profile of Walsall citizens: Walsall Census 2021
This information is crucial in ensuring that adult social care services are shaped and commissioned to meet ethnic and cultural needs
Sexual Orientation and Gender of Walsall Citizens
The 2021 census provides an estimate of the sexual orientation of people within the Borough of Walsall which shows:
- 90.24% straight
- 1.08% gay or lesbian
- 0.84% bisexual
- 0.25% other sexual orientations
- 7.6% of residents didn’t answer the question.
Data on gender identity was also released, confirming the following statistics for the Walsall Borough:
- 92.90 % (207,254) identify with the gender they were born with
- 0.27% (592) identify with a different gender than from their sex at birth
- 0.09% (196) identify as a trans woman
- 0.09% (207) identify as a trans man
- 0.03% (57) identify as non-binary
- 0.02% (34) identify as “other gender identities”.
This intelligence is important in ensuring that commissioned adult social care services are accessible to people of different genders and sexual orientations.
Life limiting long-term illness
It is estimated that 16,600 Walsall residents currently live with a life limiting long-term illness in 2024 (5.6% of the Walsall population).
Mental Health
It is estimated that 1 in 4 Adults in Walsall experiences a mental health condition in any given year. According to the Walsall Mental Health Strategy, 28% of people in Walsall rate their mental-wellbeing as low and 19.4% of Walsall residents experience anxiety and depression. (Source: Walsall Mental Health Strategy). In Walsall, the most common mental health problem is, and continues to be, “common mental disorder”. “Two or more psychiatric disorders” is the second most common mental health problem with a starting base of 12,065 in 2020 (Source: People Too Analysis, 2023).
Neurodiversity and Learning Disability
The Walsall population with an Autistic Spectrum Disorder (ASD) condition is estimated to be 1,660 people. The highest population with ASD is the 25-34 group (Source: People Too Analysis, 2023). It is estimated that 19.1 % of Walsall residents are registered disabled.
Dementia and dementia prevalence
Dementia is a disease of the brain that affects memory, thinking, comprehension, calculation, language, learning capacity, personality and movement. In the UK it is estimated that 944,000 people have dementia and that 1 in 3 people over 65 will have dementia. Walsall has high prevalence of dementia and risk factors among citizens that increase the risk of dementia: obesity, smoking, excessive, alcohol consumption, hyper-tension, diabetes, an ageing population, significant disadvantage and deprivation and ethnic diversity. Smoking, for example, doubles the risk of getting dementia and people with diabetes are 60% more likely to get dementia. People with learning disabilities are also at higher risk of dementia.
As of February 2020, it was estimated that 9,158 people over 65 in the Black Country were diagnosed with dementia and in Walsall there was a recorded prevalence of 3.85% compared to a West Midlands rate of 3.77% (Dementia prevalence counts the number of cases in a population at any one time). The general predicted dementia trend in Walsall is increasing. By 2040 dementia is estimated to increase by 26% with the largest proportion of people with dementia age 80+ years of age. (Walsall Council Public Health Dementia Needs Analysis 2024).
Future projected population data
The following tables set out projected Walsall population increases to 2040 by age and different needs. This context is crucial in planning our adult social care services for the future. We will update this contextual information annually to assist providers in business planning.
| Older people over 65 | 2023 | 2025 | 2030 | 2035 | 2040 |
|---|---|---|---|---|---|
| People aged 65 and over | 44,300 | 45,000 | 48,300 | 51,600 | 53,900 |
| % Change from 2023 | 0% | 2% | 9% | 16% | 22% |
| People aged 85 and over | 7,100 | 7,300 | 7,900 | 8,900 | 9,300 |
| % Change from 2023 | 0% | 3% | 11% | 25% | 31% |
| Older people over 65 | 2023 | 2025 | 2030 | 2035 | 2040 | % Change to 2040 |
|---|---|---|---|---|---|---|
| People living with dementia aged 65+ | 3,713 | 3,824 | 4,049 | 4,350 | 4,687 | 26% |
| People living with limiting long term illness where daily activities are impacted a lot | 16,366 | 16,672 | 17,797 | 19,086 | 20,212 | 23% |
| People unable to manage at least one personal care task | 14,841 | 15,160 | 16,201 | 17,306 | 18,266 | 23% |
| People unable to manage at least one domestic care task | 15,050 | 15,364 | 16,356 | 17,447 | 18,488 | 23% |
| People aged 18-64 | 2023 | 2025 | 2030 | 2035 | 2040 | % Change to 2040 |
|---|---|---|---|---|---|---|
| Total Population aged 18-64 | 170,100 | 172,000 | 176,200 | 180,100 | 183,800 | 8% |
| People with a moderate or severe learning disability | 949 | 962 | 993 | 1,019 | 1,041 | 10% |
| People with autism spectrum disorder | 1,689 | 1,708 | 1,749 | 1,786 | 1,823 | 8% |
| People with a serious or moderate personal care disability | 8,048 | 8,178 | 8,268 | 8,303 | 8,549 | 6% |
| People with a common Mental Health disorder | 32,212 | 32,621 | 33,392 | 34,096 | 34,791 | 8% |
| People predicted to have a borderline personality disorder | 4,090 | 4,142 | 4,240 | 4,329 | 4,417 | 8% |
| People predicted to have an antisocial personality disorder | 5,675 | 5,741 | 5,880 | 6,002 | 6,128 | 8% |
| People predicted to have a psychotic disorder | 1,191 | 1,205 | 1,234 | 1,260 | 1,286 | 8% |
| People predicted to have two or more psychiatric disorders | 12,252 | 12,404 | 12,699 | 12,965 | 13,232 | 8% |
| People with a learning disability predicted to display challenging behaviour | 77 | 77 | 79 | 81 | 83 | 8% |
Source: Poppi and Pansi Population Projections.
Reproduced from the Ordnance Survey mapping with the permission of the Controller of His Majesty's Stationery Office. © Crown Copyright. Unauthorised reproduction infringes Crown copyright and may lead to prosecution or civil proceedings. © Crown Copyright and database rights 2025 Ordnance Survey AC0000811014