Market Position Statement 2025 to 2040 for Services for Working Age Adults with Long-Term Needs - Future Projected Demand For These Services
Adult Social Care demand projections
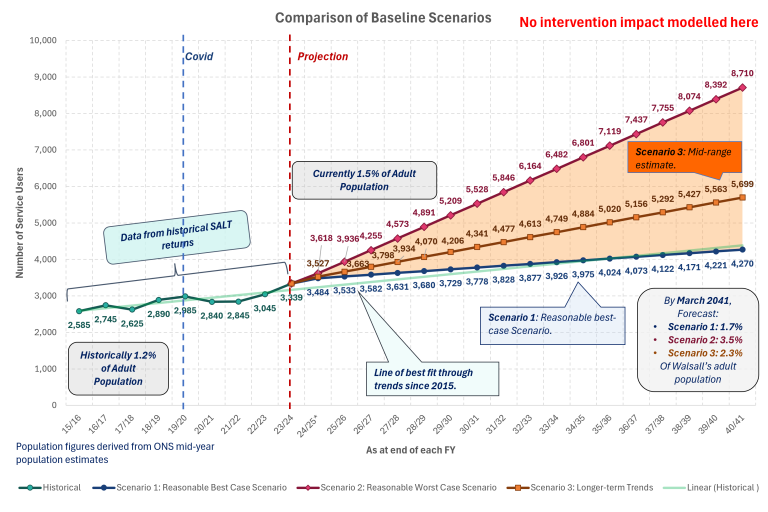
The graph below shows possible scenarios in terms of estimated increase of adult social care service users each year through to 2040/2041.
The light blue circle line shows historical trends in numbers of people in receipt of ASC services tracked to date and the dark blue circle line continues this trajectory. This dark blue circle shows that by March 2040 there could be 4,221 service users from a baseline position now of circa 3,500 (17% increase)
The dark red line is based on the increase in the ASC service users in the past 18 months (May 2023 – November 2024). This line is much steeper and number of projected service users is higher because it shows estimated number of service users through to 2040 on a fixed rate if this growth continues. This dark diamond red line shows that by 2040 there could be 8,074 service users from a baseline position now of circa 3.500 (57% increase).
This scenario is a doubling of the size of ASC clients from now to 2040, with an increase of circa 300 clients a year.
The orange circle line is a mid-point estimate. It estimates that the number of ASC clients by 2040/2041 could be 5,699 (39% increase). The orange circle line is the projection line that Adult Social Care is using to seek to predict overall demand to 2040/2041.

Estimating future demand for different types of services for working age adults with long-term needs over the next 15 years is predictive based on a variety of factors. Factors include:
- Projected population growth in Walsall to 2040 (ONS estimated, Poppi and Pansi data)
- Adult Social Care demand data - historical, last 18 months, last 12 months as per the scenarios presented above
- Children’s Services data such as Education and Health Care Plan (EHCP) projected rates to 2040
- Taking into account the impact and lag that covid had on demand
- Public health data such co-morbities data, mental ill-health, learning disability and other needs analysis in the JSNA and other documents JSNA - Walsall Insight
- Different scenarios that could play out between now and 2040.
Projected Demand For Supported Living
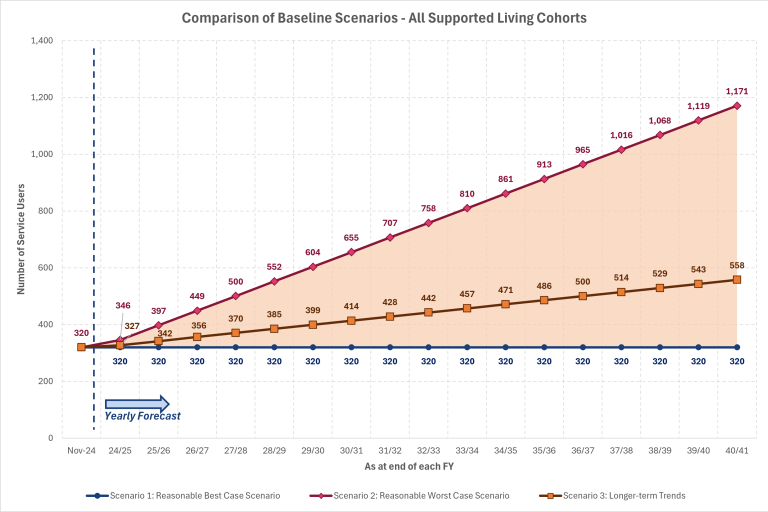
The table and graph below show scenarios that could play out in terms of demand supported living from a baseline position of November 2024. There is a 3-year estimation and an estimation to March 2040.
This scenario is based on:
- Using supported living demand data for the last 12-18 months
- Assume this rate of growth continues and is fixed at this rate (not exponential growth)
- This table represents a ‘mid-point scenario’ for the growth in demand for supported living (orange line on the graph below)
- It is based on a non-interventionist ‘do nothing’ scenario i.e. not changing the course of demand for supported living and/ or creating the right type of supported living to meet needs.
| Type of specialist service | Baseline Nov 1st 2024 | End March 2028 | End March 2040 |
|---|---|---|---|
| Supported Living | 323 | 385 | 558 (73% increase) |
The graph below shows this increase on the orange square line. It shows from a baseline now what the year on year increased are projected to be for supported living clients funded by Adult Social Care up to 2024/2041

This data does not directly include Council Children’s Services projections on the number of 0-25 year olds with EHCPs for a range of needs including autistic spectrum conditions and social emotional and mental health but this is a relevant factor in looking forward to possible demand for adult social care services by 2040.
Between 2015 and 2024 there has been a significant increase in the % of Walsall children and young people with an EHCP: Walsall has the highest number of children and young people age 0-25 in the West Midlands with EHCPs. This is estimated to grow by a projected 36.6% of all 0-25 year-olds by 2040. This is not to say that all people with an EHCP will need adult social care support or supported living, but this information provides one additional indicator of potential increases in demand for the services covered in this MPS.
Implications Of These Scenarios For Supported Living
The implication of this ‘do nothing’ scenario is growth in demand for supported living from the current baseline. The predicted growth in this scenario is coming from a range of sources including Children’s Services (Transitions to Adulthood), Locality Teams, Learning Disability and Mental ill-Health Teams and from NHS services.
Implications for supply of supported living
This degree of growth has significant implications for the supply of supported living. The supply of Supported Living is unlikely to keep up with demand unless there is an expansion in supply, a planned pipeline of developments and the type of supported living needed to meet diverse and specialist needs.
Recent Review of Accommodation in Walsall
A recent Housing-Led review of accommodation in Walsall supports these demand projections for working age adults and the projected need for accommodation by 2040. National demand projections when scaled by population to Walsall underscore the need to better understand the demand-supply imbalance in more detail. Walsall is expected to see significantly increased demand from working age adults for different forms of accommodation.
Below shows a summary of estimated supported housing units needed to meet need of working age adults in Walsall on scaling of National Housing Federation (NHF) projections for England 2025-2040.
| Type of need | 2025 | 2030 | 2035 | 2040 | Change | % Change |
|---|---|---|---|---|---|---|
| Learning Disability | 61 | 72 | 85 | 101 | 40 | 66% |
| Physical disability/ sensory impairment | 18 | 22 | 27 | 34 | 16 | 89% |
| Mental health problems | 2,391 | 2,454 | 2,506 | 2,560 | 169 | 7% |
Projected Demand for Shared Lives
The table below shows estimated demand projections for Shared Lives between now and 2040. These estimates are considered conservative with hopes of a 10% increase year on year being considered for this service.
| Type of specialist service Shared Lives | Baseline Nov 1st 2024 | End March 2028 | End March 2040 | % increase |
|---|---|---|---|---|
| 18-64 complex | 55 | 57 | 62 | 12.7% |
| 18-64 non-complex | 6 | 6 | 8 | 25% |
| 65+ complex | 8 | 8 | 8 | 0% |
| 65+ non-complex | 0 | 0 | 0 | 0% |